September/October 2016
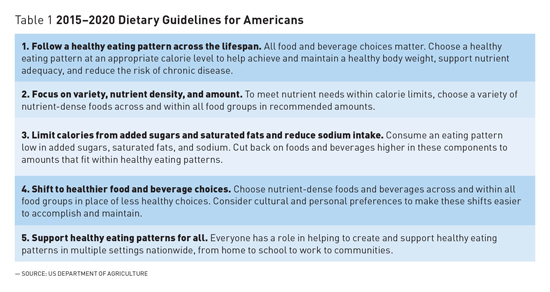
2015–2020 Dietary Guidelines for Americans: Implications for Older Adults Based on the newly developed 2015–2020 Dietary Guidelines for Americans, experts offer recommendations on dietary patterns designed for optimal nutrition among older adults. Every five years for the last 35 years, the US Department of Agriculture (USDA) and the National Institutes of Health have chosen a committee of experts to review the scientific evidence regarding diet, nutrition, and health among Americans. This process, referred to as Dietary Guidelines for Americans (DGA), provides a scientific report that serves as a foundation for public health policy and guides regulations that will ensure access to a safe and healthy food supply. Furthermore, the guidelines provide a foundation for healthy aging (See Table 1) and serve as a starting point for those reaching the sixth decade of life and beyond.
In addition to utilizing public health guidelines to orchestrate a healthy dietary pattern, the authors appreciate that aging is associated with a greater risk of many acute and chronic illnesses that require very specific and personalized dietary and nutritional interventions. It is critical that the health care team utilize the expertise of trained experts, registered dietitians (RDs) or registered dietitian nutritionists (RDNs), to assist providers in developing personalized recommendations for common diseases such as diabetes, hypertension, dyslipidemias, and obesity. The following information will highlight some of the key messages of the new DGA 2015–2020 that are particularly relevant to the aging population. In addition, the authors discuss some of the prevalent nutritional deficiencies that practitioners must address in their elder patients. A Healthy Dietary Pattern
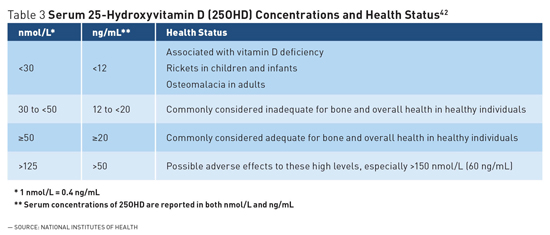
Finally, a major addition to the 2015–2020 DGA is the recommendation to consume less than 10% of total calories from added sugars each day. This amount is based on the concept that only 10% of discretionary calories remain if an individual is consuming a nutrient-rich healthy diet. Large cross-sectional surveys suggest that American adults consume an average of 73 g of added sugars, nearly 300 calories, each day.3 By 2018, all food manufacturers will be required to list added sugars on food labels' nutrition facts panels. Sugar-sweetened beverages (SSBs) such as soft drinks, juice drinks, sweet tea, and sports beverages are major sources of added sugars in the American diet.4 Although the prevalence of SSB consumption is lower among older adults than younger age groups,4 reducing SSB intake should be encouraged. Additional strategies include decreasing portion sizes of desserts and sweet snacks and choosing unsweetened fruit sauces and yogurts.1 Obesity However, a basic understanding of obesity is very simple: It is the result of a sustained imbalance where caloric consumption from food and alcohol exceeds caloric expenditure from physical activity and metabolism. Physical activity is encouraged to promote weight loss and increase muscle strength in combination with changes in the dietary pattern, providing a modest but continuous reduction in caloric intake. Dietary patterns that support healthy weight loss include consuming nutrient-dense foods. Nutrient-dense foods include those that are rich sources of vitamins, minerals, and phytochemicals, yet have relatively few calories. Even modest weight loss of 3% to 5% in an overweight individual can produce clinical benefits in health. The DGA notes that there are many dietary patterns, such as Dietary Approaches to Stop Hypertension, the Healthy US-Style Eating Pattern, the Healthy Mediterranean-Style Eating Pattern, and the Healthy Vegetarian Eating Pattern, which can be employed to manage weight. Those needing assistance in defining strategies that are best suited to each individual will benefit from referral to a nutrition professional such as an RD or RDN.8 Clinical Assessment and Treatment Sarcopenia The Healthy US-Style Eating Pattern of the DGA recommends 5½-ounce equivalents of protein foods per day at the 2,000-calorie level, while the Healthy Mediterranean-Style Eating Pattern and Healthy Vegetarian Eating Pattern recommend 6½- and 3½-ounce equivalents of protein foods per day, respectively. Some studies have reported potential benefits of higher protein intakes for older adults; however, more research is needed to provide more precise guidance. Presently, it is imperative that the current recommended intake is met with high quality meat or vegetable protein and is coupled with routine exercise to suppress, slow down, or reverse the process of sarcopenia. Clinical Assessment and Treatment Dietary Fiber Soluble fibers are metabolized by colonic microflora to a much greater extent than insoluble fibers, and many water-soluble fibers have high water-binding capability that produces a viscous solution that slows gastric emptying, allowing for slower digestion and absorption.19 Dietary patterns rich in foods containing viscous soluble fiber are associated with a lower risk of cardiovascular disease because they decrease blood pressure, lower serum cholesterol, and reduce biomarkers of inflammation.20 The fiber that is partially fermented by gut microflora is beneficial for diabetics because these microflora increase satiety and improve insulin sensitivity.21 Additionally, insoluble fibers, along with adequate hydration, are important for reducing constipation, which is often a concern for older adults.21 Most older Americans consume approximately 15 to 17 g of fiber per day,22 an amount lower than the recommended adequate intake of 25 g per day for women and 38 g per day for men (or approximately 14 g/1,000 kcal/day).23 Vegetables and whole grains contribute the largest amount of fiber in the USDA Food Patterns. Fruits also provide a substantial amount of fiber.24 The DGA recommends at least one-half of all grains be consumed as whole grains. Apart from dietary fiber, whole grains provide other protective health benefits from bioactive compounds found in bran and germ such as vitamins, minerals, and many different phytochemicals.25 Ways to increase whole grains include replacing refined grains with foods such as oatmeal; whole grain ready-to-eat cereals, pasta, and rice; and whole wheat breads, rolls, and bagels.1 Incorporating more vegetables and legumes can also significantly increase dietary fiber intake.1 Clinical Assessment and Treatment Bone Health: Calcium and Vitamin D Bone health is particularly relevant to aging individuals for whom the risk of osteopenia and osteoporosis is increased, which escalates the risk of hip and spine fractures and ultimately increases the risk of mortality.29,30 More than 53 million people in the United States either have osteoporosis or are at high risk for osteoporosis due to low bone mass.31 In addition, 1.5 million fractures are attributed to osteoporosis each year.32 The risk of bone disease increases with aging due to the decline in the endogenous production of estrogen in women and testosterone in men. Women are especially vulnerable to bone loss, because estrogen deficiency accompanying menopause generally occurs around the age of 50, whereas the decline in testosterone production in men often occurs gradually over later years.27,33 The recommended dietary allowance of calcium for men aged 51 to 70 is 1000 mg/day. For women aged 51to 70 and all adults over the age 70, that recommendation increases to 1,200 mg/day.34 Dietary calcium intake among older adults is frequently lower than the recommendations; the mean calcium intake for adults aged 60 and older is less than 1,000 mg/day.26 Calcium intake is best improved through consumption of dairy products (lower-fat dairy products recommended) or fortified foods.26 Although many vegetables such as kale and broccoli are sources of calcium, the bioavailability of calcium from these foods, compared with dairy products, is poor.35 For those not meeting the recommended calcium intake from foods, supplements are often recommended; however, careful assessment is advisable to ensure that the total combined calcium intake from food and supplements does not exceed the tolerable upper limit of 2,000 mg/day.36 Vitamin D is essential for the host to absorb and metabolize calcium and is increasingly linked to diverse health outcomes related to cognition, immune function, and muscle performance.28 The skin produces vitamin D in response to sunlight; thus, older adults are at a greater risk for deficiency because of their limited sunlight exposure coupled with a reduced dietary intake.37,38 The prevalence of inadequate vitamin D status, as defined by a blood test (25-hydroxy-vitamin D of <20 ng/mL) ) among adults over the age of 60 has been estimated to be between 30% and 50%.39,40 A chronic deficiency reduces bone mineralization28 and may increase fracture risk.34 The recommended dietary allowance of 600 IU/day (serum 25OHD concentration of 15 ng/mL or 37.5 nmol/L) has been established for adults aged 51 to 70 and 800 IU/day (serum 25OHD concentration of 20 ng/mL or 50 nmol/L) for adults over the age of 70.34 The number of vitamin D–rich foods is rather limited (fatty fish, fortified dairy products, and ready-to-eat cereals), so a dietary supplement is reasonable for those at risk of inadequate intake. Clinical Assessment and Treatment
Eye Health: Lutein and Zeaxanthin It has long been appreciated that vitamin A plays a key role in eye health and remains a major health issue in developing nations. A growing body of evidence provides a plausible role for the carotenoids lutein and zeaxanthin, which both accumulate in the human lens47,48 and may provide protection by reducing light-initiated oxidative damage.48,49 Adequate intake of antioxidant nutrients vitamin E and vitamin C as well as omega-3 fatty acids are being investigated to improve eye health, but more evidence-based consensus to define optimal intake is required. In general, studies support the role of lutein and zeaxanthin in preventing AMD, though after diagnosis, benefits of carotenoid supplementation studies are less consistent. Rich sources of dietary lutein and zeaxanthin are found in green leafy vegetables such as kale, collard greens, and spinach. Ongoing research will allow expert committees to evaluate the potential benefit lutein and zeaxanthin have on eye health in order to establish possible Dietary Reference Intakes for these carotenoids. Summary — Qi Hui Wong is a student in the division of medical dietetics of the School of Health and Rehabilitation Sciences at the Ohio State University in Columbus. — Elizabeth Grainger, PhD, RDN, is a nutrition researcher in the Laboratory of Nutrition and Cancer Prevention at the Ohio State University Comprehensive Cancer Center. — Steven K. Clinton, MD, PhD, is a medical oncologist at the Ohio State University James Cancer Hospital. A program leader in the Ohio State Comprehensive Cancer Center, he served on the 2015–2020 US Dietary Guidelines Advisory Committee. References 2. Rehm CD, Penalvo JL, Afshin A, Mozaffarian D. Dietary intake among US adults, 1999-2012. JAMA. 2016;315(23):2542-2553. 3. Martinez Steele E, Baraldi LG, Louzada ML, Moubarac JC, Mozaffarian D, Monteiro CA. Ultra-processed foods and added sugars in the US diet: evidence from a nationally representative cross-sectional study. BMJ Open. 2016;6(3):e009892. 4. Park S, Xu F, Town M, Blanck HM. Prevalence of sugar-sweetened beverage intake among adults — 23 states and the District of Columbia, 2013. MMWR Morb Mortal Wkly Rep. 2016;65(7):169-174. 5. Clinical guidelines on the identification, evaluation, and treatment of overweight and obesity in adults — the evidence report. National Institutes of Health. Obesity Res. 1998;6(Suppl 2):51S-209S. 6. Pi-Sunyer X. The medical risks of obesity. Postgrad Med. 2009;121(6):21-33. 7. Flegal KM, Carroll MD, Kit BK, Ogden CL. Prevalence of obesity and trends in the distribution of body mass index among US adults, 1999-2010. JAMA. 2012;307(5):491-497. 8. American Heart Association Taskforce on Practice Guidelines, Obesity Expert Panel. Executive summary: guidelines (2013) for the management of overweight and obesity in adults. Obesity. 2014;22(Suppl 2):S5-S39. 9. Hu F. Measurements of adiposity and body composition. In: Obesity Epidemiology. New York, NY: Oxford University Press; 2008:53-83. 10. Sakuma K, Yamaguchi A. Sarcopenic obesity and endocrinal adaptation with age. Int J Endocrinol. 2013;2013:1-12. 11. Baumgartner RN, Koehler KM, Gallagher D, et al. Epidemiology of sarcopenia among the elderly in New Mexico. Amer J Epidemiol. 1998;147(8):755-763. 12. Gaffney-Stomberg E, Insogna KL, Rodriguez NR, Kerstetter JE. Increasing dietary protein requirements in elderly people for optimal muscle and bone health. J Am Geriatr Soc. 2009;57(6):1073-1079. 13. Phillips SM, Chevalier S, Leidy HJ. Protein "requirements" beyond the RDA: implications for optimizing health. Appl Physiol Nutr Metab. 2016;41(5):565-572. 14. Calvani R, Marini F, Cesari M, et al. Biomarkers for physical frailty and sarcopenia: state of the science and future developments. J Cachexia Sarcopenia Muscle. 2015;6(4):278-286. 15. Rubbieri G, Mossello E, Di Bari M. Techniques for the diagnosis of sarcopenia. Clin Cases Miner Bone Metab. 2014;11(3):181-184. 16. Woods JL, Iuliano-Burns S, King SJ, Strauss BJ, Walker KZ. Poor physical function in elderly women in low-level aged care is related to muscle strength rather than to measures of sarcopenia. Clin Interv Aging. 2011;6:67-76. 17. Katz S. Assessing self-maintenance: activities of daily living, mobility, and instrumental activities of daily living. J Am Geriatr Soc. 1983;31(12):721-727. 18. Dupuy C, Lauwers-Cances V, Guyonnet S, et al. Searching for a relevant definition of sarcopenia: results from the cross-sectional EPIDOS study. J Cachexia Sarcopenia Muscle. 2015;6(2):144-154. 19. Gropper SS, Smith JL. Fiber. In: Advanced Nutrition and Human Metabolism. 6th ed. Belmont, CA: Wadsworth, Cengage Learning; 2013:111-136. 20. Slavin J. Fiber and prebiotics: mechanisms and health benefits. Nutrients. 2013;5(4):1417-1435. 21. Marlett JA, McBurney MI, Slavin JL, American Dietetic Association. Position of the American Dietetic Association: health implications of dietary fiber. J Am Diet Assoc. 2002;102(7):993-1000. 22. McGill CR, Birkett A, Fulgonii III VL. Healthy Eating Index-2010 and food groups consumed by US adults who meet or exceed fiber intake recommendations NHANES 2001-2010. Food Nutr Res. 2016;60:29977. 23. Institute of Medicine. Dietary Reference Intakes for Energy, Carbohydrates, Fiber, Fat, Fatty Acids, Cholesterol, Protein, and Amino Acids. Washington, D.C.: The National Academic Press; 2002:339-421. 24. Office of Disease Prevention and Health Promotion, US Department of Health and Human Services. Scientific Report of the 2015 Dietary Guidelines Advisory Committee. 25. Reicks M, Jonnalagadda S, Albertson AM, Joshi N. Total dietary fiber intakes in the US population are related to whole grain consumption: results from the National Health and Nutrition Examination Survey 2009 to 2010. Nutr Res. 2014;34(3):226-234. 26. Hoy MK, Goldman JD. Food Surveys Research Group dietary data brief no. 13: calcium intake of the U.S. population. http://www.ars.usda.gov/SP2UserFiles/Place/80400530/pdf/DBrief/13_calcium_intake_0910.pdf. Published September 2014. 27. Institute of Medicine. Ross AC, Taylor CL, Yaktine AL, Del Valle HB, eds. Overview of Calcium Dietary Reference Intakes. Washington, D.C.: The National Academies Press; 2011:35-74. 28. Institute of Medicine. Ross AC, Taylor CL, Yaktine AL, Del Valle HB, eds. Overview of Vitamin D Dietary Reference Intakes. Washington, D.C.: The National Academies Press; 2011:75-124. 29. Calcium. US Department of Health & Human Services website. https://ods.od.nih.gov/factsheets/Calcium-HealthProfessional/. Updated June 1, 2016. Accessed July 14, 2016. 30. Ioannidis G, Papaioannou A, Hopman WM, et al. Relation between fractures and mortality: results from the Canadian Multicentre Osteoporosis Study. CMAJ. 2009;181(5):265-271. 31. Handout on health: osteoporosis. National Institutes of Health website. http://www.niams.nih.gov/health_info/bone/osteoporosis/osteoporosis_hoh.asp. Updated February 2016. 32. Position statement. American Academy of Orthopaedic Surgeons website. http://www.aaos.org/CustomTemplates/Content.aspx?id=5604&ssopc=1. Accessed July 21, 2016. 33. Cauley JA, Danielson ME, Greendale GA, et al. Bone resorption and fracture across the menopausal transition: the Study of Women's Health Across the Nation. Menopause. 2012;19(11):1200-1207. 34. Institute of Medicine. Ross AC, Taylor CL, Yaktine AL, Del Valle HB, eds. Dietary Reference Intakes for Adequacy: Calcium and Viamin D Dietary Reference Intakes. Washington, D.C.: The National Academies Press; 2011:345-402. 35. Weaver CM. Calcium. In: Erdman JW, McDonald IA, Zeisel SH, eds. Present Knowledge in Nutrition. 10th ed. Wiley-Blackwell; 2012:434-446. 36. Institute of Medicine. Ross AC, Taylor CL, Yaktine AL, Del Valle HB, eds. Dietary Reference Intakes for Adequacy: Calcium and Viamin D Dietary Reference Intakes. Washington, D.C.: The National Academies Press; 2011:479-512. 37. Holick MF, Chen TC. Vitamin D deficiency: a worldwide problem with health consequences. Am J Clin Nutr. 2008;87(4):1080S-1086S. 38. Nair R, Maseeh A. Vitamin D: the "sunshine" vitamin. J Pharmacol Pharmacother. 2012;3(2):118-126. 39. Forrest KY, Stuhldreher WL. Prevalence and correlates of vitamin D defiency in US adults. Nutr Res. 2011;31(4):48-54. 40. Yetley EA. Assessing the vitamin D status of the US population. Am J Clin Nutr. 2008;88(2):558S-564S. 41. Feskanich D, Willett W, Colditz G. Walking and leisure-time activity and risk of hip fracture in postmenopausal women. JAMA. 2002;288(18):2300-2306. 42. Vitamin D. National Institutes of Health website. https://ods.od.nih.gov/factsheets/VitaminD-HealthProfessional/. Updated February 11, 2016. 43. Vishwanathan R, Johnson EJ. Eye Disease. In: Erdman JW, McDonald IA, Zeisel SH, eds. Present Knowledge in Nutrition. Wiley-Blackwell; 2012:939-981. 44. Klein R, Chou CF, Klein BE, Zhang X, Meuer SM, Saaddine JB. Prevalence of age-related macular degeneration in the US population. Arch Ophthalmol. 2011;129(1):75-80. 45. Congdon N, O'Colmain B, Klaver CC, et al. Causes and prevalence of visual impairment among adults in the United States. Arch Ophthalmol. 2004;122(4):477-485. 46. Chou R, Dana T, Bougatsos C, Grusing S, Blazina I. Screening for Impaired Visual Acuity in Older Adults: A Systematic Review to Update the 2009 US Preventive Services Task Force Recommendation. Rockville, MD. 2016. 47. Delcourt C, Korobelnik JF, Barberger-Gateau P, et al. Nutrition and age-related eye diseases: the Alienor (Antioxydants, Lipides Essentiels, Nutrition et maladies OculaiRes) Study. J Nutr Health Aging. 2010;14(10):854-861. 48. Roberts JE, Dennison J. The photobiology of lutein and zeaxanthin in the eye. J Ophthalmol. 2015;2015. 49. Johnson EJ. Nutrition and the aging eye. In: Bales CW, Ritchie CS, eds. Handbook of Clinical Nutrition and the Aging Eye. New York, NY: Humana Press; 2009:99-120. |